[chart soon]
Sunday, May 31, 2009
Currencies
We wrote in a previous, we are intermediate term bullish on the dollar. We have a small dollar long position on since the 79.8 level on the index. We are looking for the dollar to bottom soon.
Sector Sweep

We did a sector sweep yesterday (http://finviz.com/groups.ashx is quite helpful to find out sector rotation) and we think we found a good one to find longs.
The chart is shown with the ew labels. We are looking for a retracement of the triangle apex.
Potential longs are D, SO, EXC, DUK, AEP, etc...
The good news is this sector is filled with stocks offering super dividends. So any profits we stumble upon ;-), we will take in the form of stock.
Saturday, May 30, 2009
Stocks to watch
Listed are a few stocks with possible bullish formations.
The chart is pretty much clear, in our opinion. Use both the daily and weekly charts.
1) R (Ryder)
2) BSY
3) IX
4) NVS
5) KSU
6) GBX
7) TSO
Friday, May 29, 2009
A brain dump of charts
This post is basically a brain dump of ew labels for some of the bellwether stocks.
1) AAPL


The ew labelling is on the left on a 3 year weekly chart. The longer term monthly chart is on the right. Look at the volume in the last 3 months and the 20 month moving average right above.
2) GS

Nothing much to add, the chart speaks quite loud in our opinion.
3. DIS

We have superimposed black lines on the action to illustrate what we think is a triangle formation. We cannot count 5 waves down in the recent 2 years in disney, which leads us to choose this labelling. The alternate count is disney is currently in its fourth wave (but it seems a stretch to us) so we will keep it as above. Here the target in the next year or so is in the 30 region.
4...
We'll add some charts to this post as time goes on. If you want any long term charts let us know.
Common theme and a rant (feel free to ignore):
Now lets step back and look at the fundamentals behind the economy. Quite a few chartists believe,everything is in the charts. According to us partly true, but we simply cannot digest that our history completely governs our future. Sure it has a part to play but our actions hence too play an important role. For more about our model see (http://maybeitsclarke.blogspot.com/2009/05/time-again-to-short-gold-stocks.html).
What we are trying to say is this - In most of the charts above we have labelled 3 waves down, upto the march low. Technically, by elliott's theory it is a "completed" correction wave structure. The question is it the end of the bear?- the answer is in theory there is a tiny possibility that it is the end of the bear market (in nominal terms), but surely not in terms of real money. For e.g. say the govt tomorrow starts actively employing the zimbabwean school of economics and prints and doles out sums of money to everyone. Can the inflation lift stocks? In nominal terms by all means.
So keeping this in mind, lets look at what is more likely to happen? The govt continues to throw money at the problem, though nowhere near the pace of zimbabwe. So what we may get is a 4th wave triangle. That would mean we trade in this range another 5-10 years. We are now in a 'd' wave. This gigantic triangle takes about 15-20 (2001-...) years to finish. This is just a caveat type of thought at what the chart could morph into - like the chart of taiwan or the nikkei (in terms of dollars) - a 20 yr triangle/pennant. So as everything take it FWIW. Lets keep an open mind is what we are advocating.
Exhilirating Day
An exhilirating day to say the least, lived up to its billing of a key day. We will post some charts this weekend and review our turndates etc. stay tuned.
May 29
11:10 P.M Very whippy, no way out yet. On the other hand, we just cannot stop ourselves from shorting the precious metals. We may be shooting the trend here (which is clearly short term up), but the 200W is right at 25 for SSRI, the risk reward is too good. So, we added a sliver of SSRI short at 24.5
2:30 P.M Whippy action continues. But one market has been a straight line today. The yields have gone straight down. A big shout out to Jenszen who pointed out the seasonal play in TLT beginning end of may. We wrote about this seasonality in our blog post yesterday. J is in TBT puts @56 from 2 days prior.
2:45 P.M SSRI seems to be cratering. Lowering buy stops to 23.9. Atleast we have about 2% profit on a day like today.
3.00 P.M Covered 50% of SSRI at 23.7 for a 3% profit.
3:30 P.M One step up, one step down. We are not dancing.
4.00 P.M Breakout. Wohoo!! the bulls win again. We blogged yesterday about this hunch. We have maintained for a while now, our long term cycles top only in June. We will look for distribution patterns then. We reiterate again, today is a key day. We think the 200d will be assailed and the target for the SPY is the 50W moving average.
Lets rationalize with some sentiment(always with care :-)), the 200d is like the definition of the bear market to many people. A 5-10% incursion above it, is enough to drag quite a few folks onto the bull side, claiming the bear is officially dead. Bear markets have vicious rallies in direct proportion to the viciousness of the bear. This one seems like it will be real vicious bear when it wakes up later.
Thursday, May 28, 2009
Another try at shorting precious metals
Gold & silver are in a clear short term uptrend. Let us add a caveat beforehand, our record at timing gold, silver is about 2/3 (right). So take it FWIW as everything.


Now, lets look at long term monthly charts on gold miners.
We choose the miners to plot because these are so much more volatile and a chart with greater volatility shows clearer herding behavior of greed and fear.


Above is a chart of a gold miner ABX and a silver producer SSRI. The ew labelling is shown above. The takeaway is we had a huge run up until Mar 2008 (it became a crowded trade). We can chart 3 waves down, signalling we had a correction until Oct-Nov 2008. So, we had a bull market of ~ 88 months (since 2000). We had a bear of 8 months, and then a rebound. This doesn't seem sufficient timewise. We would atleast like a 25%-50% time correction. Gold has not had one down year in the last 8 years.
As for ABX and SSRI, key monthly averages and the triangle apex are acting as magnets. The charts can penetrate those averages slightly but expect strong resistance. And we would look for any signs of divergences to pile on the short side. (Disclosure: we have a small 50% SSRI short position on from friday).
The alternate labelling is that we are done with the correction and we are onto the next leg of the bull market. We will label this secondary for another reason we elucidate after the silver chart.

The ew labels are similar to the chart above. What we point out is silver & gold have a ~8 month intermediate cycle. We had a 3 move downleg from March 08 to Oct-Nov 08. Then a 3 move upleg from Nov 08. The 8 month cycle ends around Jun11th (+/- 1 week). Silver has strong resistance around 16. Also it dropped a fibonacci $12 in the 8 months, it seems to have come up a fibonacci $8 in 8 months => the rate of descent has been greater than the ascent. Ofcourse, this doesn't preclude a bull market. But thus far the evidence is not convincing. We believe silver will top out in the 16 region. Small weekly divergences are occurring. Another nice property to note is that silver moves violently just prior to a termination. We are seeing a violent move now. So all evidence points to silver peaking.
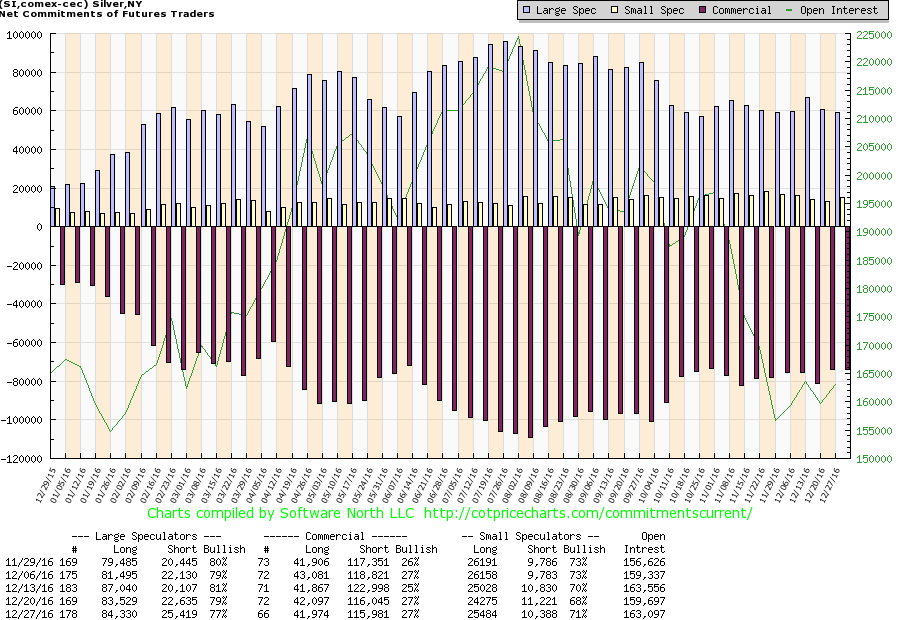
Another key piece of evidence is the commercials COT report. Commercials have a huge short position. Such a COT report usually doesn't preclude a bull run. It happens at the very end of a bull run.
Tale of two triangles
This is a long-ish post so bear with us.

This is what we meets our eye and it seems pretty obvious. Please bear with us for the quality of the screencaps. We had a top at 930 on 5/8, which was a key 45 day turndate (see http://maybeitsclarke.blogspot.com/2009/05/may-8.html). Looking back now, our post could not have been more right. We also believe our plan to stay away on either side has also been vindicated. We have labelled the above as a 'A' leg down followed by a 5 leg down 'B' wave sideways. The 'D' leg bottomed for a shot up on our May 25th turndate. The question is now whether our cycle turn was an inversion? (which can happen sometimes).
Now lets look at the periodicity of the market. The 15 period cycle which this market has religiously followed will culminate a 60 day period on June 1 monday. So the next few days are very key to watch. Yes, quite a few days are key, but the importance of the next 3-4 days cannot be stressed enough.
The bearish scenario is drawn above, if we break the triangle on the downside (885 on the SPX), then we will see lower prices into our june 11th cycle turn.
Now for the more optimistic scenario.

This labelling seems alright too. Now lets look for positives. The weekly chart, looks to us like a bull flag. Volume decreasing for the last 3 weeks in a sideways to lower move. In the last two days, the volume has surged. Today, the green volume is greater. Also the market looks like it is consolidating just beneath the 200d moving average. Such action usually leads to a break of the average. Most markets around the world have penetrated their 200d, it only seems natural for the SPX to accomplish it too. In this scenario the key is the 915 region. If that is taken out, 970 should be on.
Seasonality and The dollar:
Seasonally, May25th-May30th is a small bullish period. The treasury's bottom during this period and then start a strong seasonal rally through June. This is also a bullish period for the dollar. So, the seasonality from now on go to the bears. Which side has more horsepower?
In essence, watch and react, don't act and pray.
sell signals emerging
http://www.cnbc.com/id/30976096
1:30 p.m. Looks like the HnS intraday had the bears salivating. But until 875 breaks, all HnS are bear traps. Spectacular short squeeze. Quite a few message boards are now filled with sour traders post-reasoning, why the treasury auction is bullish etc. and how it is the work of the PPT. Tune out or use them only as a contrarian indicator (ofcourse with care). Volume is much higher than yesterday. Something the bears miss. The bears have one point on the bulls though - the russells is lagging. Not what I as a bull want to see.
5.00 P.M Things have cleared up sufficiently for us to finally do a chart post tonight. Enough of mindless rambling :-). From our scan of charts, we will present two possible scenarios, ofcourse one bullish and the other bearish. We are slightly leaning towards the bullish one. Check it out later.
Wednesday, May 27, 2009
may 27th
9:30 p.m No time for trading today but what transpired today was not good for the bulls. We will have to revise the wave count if 875 gives way. Until that we have nothing to do. As for our trades, we initiated a position in the dollar just before the close. The risk/reward of a double bottom is too good to give up.
Tuesday, May 26, 2009
May 26
10:10 a.m. Cycle turned ?? We need to break above 905 to confirm positively.
We could see a very steep climb upto the 50W MA if so. This market is teaching the bears a lesson - not to be trigger happy.
12:40 p.m. The bulls break 905. Now we need to hold it for the close. Cycle turn indeed seems to be working, so also our TNA position (long from 25.3), which we will ride with a trailing stop of 1%. Thus far, it has been a straight line so no worries.
2:30 p.m Out of tna at 26.75 for a 4% gain. We have to leave for the day, but the theme remains "Don't be a heroic bear". Wait for other bears to get slaughtered.
5:10 p.m Our cycles and seasonality work told us to keep an eye out for a blistering rally. That is exactly what we got. More importantly, the 905 area is now support again. We visited quite a few trading blogs, sites and message boards over the weekend. There was almost a unanimous HnS claim on bellwether stocks like AMZN.
The winner in this bout of technicals was clearly sentiment, seasonality and cycles.
Yes, the market was overbought, yes there were bearish divergences on the horizon, but until we get a weekly close on any of the indices under the 5Weekly moving average, the weekly trend is up and we should continue looking for higher prices. Our next cycle high date is on june 10th(+/-). For astro traders, there is also a bradley turn window in the first week of june. Some stocks like RMBS, TIE, AXYS etc. are shooting out of what looks like a bull flag. Does the weekly SPY itself look like a bull flag?? A case can be definitely be made. Will GS make it to 160? We think it is possible before our next turn date.
Monday, May 25, 2009
Cycle turns
We were out for most of last week. As for our positions, we got stopped out of tso for a 3% loss. But we also managed to book some profits on the SPY short. Now lets gets back to the future :-)
We have been mentioning there are some short term cycles turning up on May 25. So here we are, we made the nominal high on may 18th and it has been downhill since then. The 60 day cycle ends on may 30. We have another important date on jun 11th.
If we get another boost up, depends all on this time frame. We need to hold the key 8000 area on the dow by june 11th, worst case. Tomorrow is an important day to watch too. 25th may is seasonally one of the most bullish days in an year. So things are bound to be volatile.
Clues from the bond market - TLT looks to be bottoming or will do so soon, so also the dollar. The negative sentiment is clearly peaking. But we will wait for confirmations before putting on these trades. We got blown out of our gold short. Until we understand things better in the PM sector, we will stay away.
Wednesday, May 20, 2009
May 20
7.00 a.m. We will be out of town for a couple of days, so no updates until the weekend.
Tradewise, we maintain our stance of bullish against 875. Mar 25th is an important short term cycle low date, both seasonality wise and cycle wise. So we expect a strong push from may 25th onwards from wherever that may be. Ideally we would like for 875 to hold until then.
Sentiment wise,
1) The Investor intelligence survey is still looks cautious to us.
2) consumer sentiment still looks compressed to us.
3) In our scans of chat forums and message boards, there are still bears who just won't give up. Maybe they are right. While it is impossible and foolhardy to pick tops, in our opinion the sentiment is still somewhat negative out there. Bordering on cynicism, we should add - which is just the condition required for the rally to sustain.
Monday, May 18, 2009
May 18
10:50 a.m Bounce off 20d again. There are still too many doubting Thomases. Also, quite a few TA'ers thinking the small incursion below 20d on friday, would automatically mean the market going to the 50d. The market promptly reverses. As for us, we are riding TSO and our leftover positions in various stocks like PM, PBT etc. Also we added the customary sliver SPY short at 90.
Rant (feel free to ignore): Of late we feel Cramer has been wrongly castigated. He asked people to exit at 10,000 and then to get back at 6700. If anyone followed his advice, they would be smiling now. Sure, he makes bad calls. Everyone does. But if anyone followed. We are not a fan of cramer or have an association with him within 6 degrees of separation - but at face value, following his advice would have clearly brought one about 50-100% profit for this year alone.
5:45 p.m. Strong breadth/low volume. We did anticipate a rally based on friday's action but today's move (atleast for us) is not the kind we like to trade.
What next? - we think a tag and incursion of the 200d is possible. But we will not be playing it, as we cannot see any setups/patterns here. EWT sure is a great tool, but at minute levels there are umpteen labels that every hour requires a change of labels. As we have saying for umpteen posts now, we will wait for June, when our intermediate term cycles top out. Often the best trade is be flat.
Our portfolio as of now, is littered with long positions made up with house money from PM, PBT, PWE, URRE etc ...
and a new long TSO (about 10%) and SPY shorts (~ 12% av @90.5), GILD short (3%).
Yes we tested the underside of the rising trendline, but until we break 875, we are not shorting aggressively.
Here is one of the blogs we often read (and enjoy):-
The following post is quite nice. We are sure quite a few bears are following the gameplan described in there.
http://garyscommonsense.blogspot.com/2009/05/heres-why-i-prefer-not-to-fight-with.html
We follow quite a few message boards and stock chart forums filled with TA'ers. We can vouch the above has been their gameplan to a T. Quite a few Faz'ers, SRS'ers, TZA'ers have gotten obliterated. We are guilty of trying to short too but only using the methodical SPY short and covering. This has worked wonderfully well, keeps emotions out and we see no reason to discontinue it as yet.
Friday, May 15, 2009
Fri May 15
12.00 P.M Added a small portion of TSO long. Covered a portion of SPY sliver (from 90) at 88.8
2:20 P.M Since this market volume/breadth/$CPC etc are not confirming the plunge. There is a risk of a sharp rise in the next few days/weeks now. We would not want to short anything until 875 is taken out. On a technical note, the obvious target on the upside is 200d SPY. It is entirely possible that the big program trading and hedgie shorts are waiting for a tag. And since 200d is an "easy target" to start shorting. It may very well happen that the market rally a nice 5-7% above the 200d to put off rookies.
Sentimentwise (at the risk of everyone being a successful contrarian :-)), has we seen major jubiliation no! Remember this downturn started with bad news (of retail spend down). Rallies don't end on bad news. They end on good ones. We are weary because we expected a much more vicious downside thrust. Alas it seems to be missing.
We need to scan the charts to see if there any trade setups on the long side. We will report back later in the day.
6.00 P.M We could find very few convincing charts for long setups. TSO was a half baked one, so we put on a small long position. A break above 18.5 on TSO would give a massive thrust to 25, the stop is a close below the moving averages.
That being said, the market volume was low, the breadth sucked and we bounced again off the 20d ma. We don't feel like going aggressively short here. Ofcourse our sliver SPY short positions keeps us in the game. We covered some today at 88.8. We will add if the market rallies to 900. We will unload some SPY shorts at the 50d if the 20d breaks. In terms of weekly charts, most indices and SPDRs had an inside week, something to keep in mind.
We prefer to stay safe here.
Thursday, May 14, 2009
May 14
12:40 P.M Small bounce today. Should have been expected of SPX bouncing of 20d. But nothing spectacular about it. It will probably down soon, like the other indices - NDX, RUT etc.
2:50 p.m. The market is as drowsy as us. Added an SPY short sliver at 90.
2:50 p.m. The market is as drowsy as us. Added an SPY short sliver at 90.
Wednesday, May 13, 2009
May13
8:45 a.m Heavy weakness P.M. Will probably cover 1 spy sliver at 88 if it gets there.
9:20 a.m. We absolutely hate it. We stalk out and buy NVS and then it does nothing for a few days and we get out with a meagre profit. And now it gaps up 4% :-) This happened with PM too. bah! we need more patience.
1:10 p.m. Covered spy sliver short from 92.5. We have two more slivers @87.5, @90.
1:20 p.m Gold miners and PM getting smashes. And we got shaken out of SSRI short. Damn! Maybe there are phases in trading. We are probably in a lean one right now, after a fabulous run over the last month or so.
5:55 p.m Nice solid red candle with nice increasing downside breadth from monday, looks like a 3 wave of some kind. We seem to have made a top bang on our May 11th cycle turn. Next short term cycle turn is May 25th(+/-).
Now the more important question - Is the bull rally over? We are leaning towards - *not yet*. Technically, the larger term cycles don't turn until June end. More importantly, we need to see how the market handles the 20 and 50 moving averages and also April's Wave 'B' triangle consolidation(for e.g. in XLE). We are likely to see buyers turn up in that zone. The larger question in our mind is what will the bulls buy? We don't see anything attractive other than a few energy stocks, specifically natural gas stocks which is pulling back after the gusher move. Tomorrow should be the test of the 20d moving average on the SPY. The russell, tran, NDX have already failed at their 20d, which is a pointer rds further weakness. The interesting area is therefore SPX - 830 (50d). We fully believe the market will make it there in a few weeks time.
Our strategy is to short stocks that have flown up high above their 20d, e.g. AFAM. Basically, the more the separation the greater the fall. We will also start covering some SPY slivers along the way, every 25 points or so.
Tuesday, May 12, 2009
May 12
10:30 a.m. Covered SSRI for a loss of 3%. Not still broken out, but taking no risks as we may not be at our screen. NVS looking to break out. Lets see if it can do it.
1.10 a.m. NVS seemed to be failing at the 20week resistance. Bailed out at 39 for a 2.7% profit. We covered AMZN for a 2.5% profit. Quite a few sectors are red, but the volume, TICK, VIX truly suck. So other than our SPY short slivers which we regularly pick every 25+ points, we are not in the game. It is looking very likely now that we made a short term top on our May 11th cycle date. Our next cycle turn date is May 25th, which could be short term low. We still think there is another month or two left before an solid term top is made. What sectors will lead the next bout of buying? We don't know, there are extremely few setups we can see for buying now. We may have a "dead" market for sometime, probably designed to kill option traders.
1.10 a.m. NVS seemed to be failing at the 20week resistance. Bailed out at 39 for a 2.7% profit. We covered AMZN for a 2.5% profit. Quite a few sectors are red, but the volume, TICK, VIX truly suck. So other than our SPY short slivers which we regularly pick every 25+ points, we are not in the game. It is looking very likely now that we made a short term top on our May 11th cycle date. Our next cycle turn date is May 25th, which could be short term low. We still think there is another month or two left before an solid term top is made. What sectors will lead the next bout of buying? We don't know, there are extremely few setups we can see for buying now. We may have a "dead" market for sometime, probably designed to kill option traders.
Monday, May 11, 2009
May 11
12.00 a.m. We injured our shoulder this morning, so we will be out of action for the next few days sleeping and being numb most of the time :-).
2.00 p.m Quite drowsy on painkillers but nonetheless, we shorted SSRI, GDX this morning, the double top is the stop. Watching CNBC during the day is entertaining to say the least. I has been sometime now watching talking heads give their views.
6:20 P.M mild sell-off. In our brief scan AH, we don't see any clear bull setups in charts. IPSU the one we were watching (and the one which scottrade did not allow us to buy, for some strange reason) finally blasted out today. What this means is tomorrow's breadth is the key. With no apparent leaders anew, what will the bulls buy next? That being said, trash is now beginning to fall down back to earth. e.g. DRYS, CPSL etc. which had enjoyed > 100% gains are giving way.
Looking at CAT chart, could that be a small triangle in the 4th wave position? - it is definitely possible, meaning we may have another small thrust up, but it will also mean that would be the last and will fully retrace the move.
Nonetheless, this week promises to be interesting.
8:00 P.M Some possible triangle plays for a last thrust up - FMCN, AXYS, CAT, BQI (trash still going up)
Sunday, May 10, 2009
Time again to short gold stocks

Above is a wave count on XAU. In our eyes, the 5 waves down are clear with a triangle at the fourth, followed by a 3 wave rise, including a triangle in the b wve position. We will reshort gold/silver stocks at the double top, with a stop above the double stop. If our labelling is right we could have one hell of a ride down in the coming few weeks.
Rant (feel free to ignore):- We have been questioned quite a few times about the validity of TA and if it is really so powerful why doesn't everyone use it and therefore rendered useless. Our view of a stock price is that of a machine (or function/ stochastic process) with inputs at every time instant since its inception. The news now creates a new input for this machine and based on all the inputs thus far, the machine gives us a new output for the next instant, the stock price. A chart is a simplistic way of capturing this relationship in time. Sometimes, whatever be the input at the next time instant, given all the inputs thus far, the function can output only a few selected values. Think of it like a degree of freedom. For e.g if there has been only good news on a stock and it has soared relentlessly, the "surer" output is it is going down e.g AAPL circa 2008. What TA does is place odds on this "sure" bet. In our opinion quite a few technicians (including ourselves) try and time every small wiggle as if external factors don't matter. Of course they do, but the question is always to what extent. e.g in sep 08, when the bank bailout was not passed, the market crashed. The congress turned around immediately and passed it. It promptly crashed again. So one can think of it like the degree of freedom in this case was by how many points it was to crash. The unsure bet was by how many points. Since picking such moments of surety is quite subjective (in our opinion atleast), it is difficult to time every move. Often the best thing to do is not trade the stock and look for stocks with the right setup.
Friday, May 8, 2009
May 8
10:45 a.m. Today is a potential important 45 day possible cycle top from the Mar 9th lows. Keep a look out for more clues about possible tops. On the stocks front, the last bastions "energy" are eking out gains while the higher beta nasdaq is losing it, which is expected and hence our short position in AMZN yesterday. We believe the 50d will be hit on this trip. That is when we close our short.NVS is acting sickly, we will watch for a close below the moving averages and then stop out. We don't think the market will crash back to the old low, at least not in one swoop. What is more likely in our opinion, is a lengthy 3 or more months of going nowhere and a trading range, to draw a right shoulder (look at a 20 yr chart of the transports (Our earlier post)). For now we scalp and play the ranges.
1:50 A.m (9th) We were away from our desk all day, so we did not trade today. Today finishes 45 days of a rally. The percentage of stocks above their 200d is upto 50% today. Percentage of stocks above their 50d is now 94%. The daily sentiment index (jake bernstein) is 85%. Talking heads are increasingly seeing green shoots everywhere. We have quite a few bearish signs, momentum wise. Probably the most bearish is the nasdaq not confirming the dow's breakout. The nasdaq has been the leader thus far, but as we noted it is energy which is leading this last thrust up. XLE has also tagged the 200d. We have a potential short term cycle topping 8-11th. We are not going aggressively short, we will wait for the hourly average to give way before entering a sizeable short. If indeed the market falls, the next cycle turn date is the 25th of this month.
Thursday, May 7, 2009
May 7
8:30 a.m News flow is getting better and better. Time to sell is getting closer. A top may form 8th-11th.
10:30 a.m. Sold 90% of PBT (6% profit). Sold off (90%) PWE@12.7 from long term portfolio. Added another sliver of SPY short. PM looks like a bull flag, so holding onto that. In tune with yesterday, nasdaq should be the leader on the downside. Will look to add small portions of qqqq short on bear flags.
11:14 a.m PM rallying amidst a sickish market. Triangle breakouts are indeed fun (and profitable :-)) to trade. But it is also worthwhile noting, triangles are usually the last consolidation phase in the thrust higher. They also retrace upto the apex of the triangle, like XLE, nasdaq etc. have just accomplished. If you find any potential triangles do let us know :-)
11.50 a.m. Terrible natgas report, and natgas rallies. We got what we wanted. Sold the rest of the 10% of UNG. We have run up 25% in a week. While this is bullish, we can count a full 5 wave from the bottom. PM looks like another long bull flag.
12.10 a.m. Sold 80% PM for a 4% profit. Rest is house money, with 5% dividend.
1:45 p.m. back from lunch, have the flood gates opened? We don't know, but the strategy SPY slivers is simple. If SPY reaches 90, we will cover a portion of our SPY short from the morning. We have a top pencilled in 8th-11th. If indeed it is the top, the cycle turns up on the 25th later this month.
2.30 p.m Shorted AMZN at 78.8. We believe this could go all the way upto the 50d MA (~75). GILD is bouncing as expected yesterday, in wave 2. We will wait and watch how far the bounce carries it before re-shorting.
5.00 P.M This past week has been the story of one commodity - the last commodity to rebound and what a way to do it -- natgas. We nailed the bottom absolutely spot on (The widowmaker), and captured a decent portion of it. The volume surge and the percentage gain surge have been superb. Today UNG closed above its 50d for the first time in almost 10 months.
We want to maintain long positions in natural gas, for the next 4-6 months. The COT reports indicate the commercials have a historic all time high net long position. We are in for the mother of all giant squeezes, through this summer.
We believe UNG has decent upside 25-30 should be doable in 5-6 months. While it can pullback somewhat since it is thoroughly overbought, any pullback we buy slivers. Look out for a scintillating July seasonal rally in natural gas.
Wednesday, May 6, 2009
May 6
10:30 a.m PM did break out after all. Got in again @39
12:10 P.M Got into PBT into what looks like a bull flag at @9.20
1.45 p.m The mother of all tests for natgas is at hand now, 50d moving average. Accordingly, peeled off 20% of position. We only have 10% of our initial position left. We do believe there will a nice fight. Even more interesting will be the reaction tomorrow. Volume wise etc. things are very indicative of the bottom. But what is a bottom when there is no doubt about a bottom. As they say, rallies ride on skepticism and top when there is none left. We need to see how natgas handles the pullback, if at all there is one.
2.00 P.M By the way, the nasdaq has been lagging for the last week or so. This is classic sector rotation. As we said, in a post earlier, the upside in most of the NDX stocks like amzn etc. is now limited. Money is flowing into what we believe is the literally the LAST few sector where > 10% upside remains, - energy, specifically gas and gas stocks, and a few consumer stocks like PM etc. Once these are done too(and we think soon they will be), we could have a nice down leg. It is better to start hedging positions with a stable short.
4:30 P.M We were busy in the afternoon, so could not look at the tape. When even the defensive stocks are beaten down, a bear market is over (for a while atleast). This is what happened in Feb-March. Last bastions of the bull like XOM, WMT, JNJ finally succumbed and the bear market was over. This time around, exactly the opposite is true, once the last bastions of the bear market are over, the bull is dead.
In other words, we scanned a few charts last night and the number, quality of breakout patterns or charts with sufficient upside has reduced considerably. The percentage of stocks above 200d is now 40%. A massive downward correction cannot be far off. Therefore, we are also uneasy about new longs now. We will keep one eye on the door for our positions in PM, NVS, PBT which we have loaded up in the previous few days.
Tuesday, May 5, 2009
Keep an eye on
We don't have much time this week. So a brief post about stocks to watch. This is basically a list of stocks that have not yet rallied "all that much" are look promising. We would keep them on the watch list for an explosive move. The corrections thus far in these look like long bull flag formations.
1) BPT
2) PBT
3) IPSU
4) FCEL
Will add more as we spot them
May 5
11.30 a.m. Slightly busy at work today. Took 70% off the table from UNG for a 4% profit. We will wait and see if the 20d is reconquered. Stance is still bullish on the overall market. It may pullback into the high 890s or even worst case 881 (61.8% retrace of the move), but it will be a buying opp.
1.10 P.M Sold the rest of my TBT (10%). Traditionally interest rates peak in may.
1.15 P.M Covered 20% of my GILD position. Will reload higher around 46-47.
4:30 P.M Looks, smells like consolidation for another move higher. GILD could have finished wave 1 of 5 of 3. May get a small bounce, but it would be another shorting opportunity . Out of precious metal shorts from last month. Looks like a bounce is ensuing.
Monday, May 4, 2009
Possible cycle turn
Please see for the periodicity of this market.
The next 45 day interval is May 8th. We could see a possible top during that time frame. We re-ran some seasonal models. Traditionally, the first 4 trading days of May have a positive bias.
May 4
10:10 a.m. The theme of the spring/summer as we said earlier was upside surprises. This may be the last leg of the upswing, as we are breaking out of the last sector (in our opinion) energy. XLE is on fire and so is our LT pf of COP, BP, and other such energy names. We will start taking profits slowly now. Also adding another sliver of SPY short at 900.
12.45 P.M Sold PM from friday for a miserly 1.5% profit. The volume is too weak for a triangle breakout. Maybe we got too hasty. But we were not convinced one way or another. So we closed our position. The action in UNG is very encouraging.
2:40 P.M natural gas closed the pit session above the 20d. 50d has been the real challenge for this. But the volume is expanding and so is the size of the thrusts, looks quite promising thus far. The real test will come on the 7th - inventory day. We are hoping to have a disappointing inventory number. If natgas actually can hold onto its gains in the face of such numbers or even rally, that will be the best tell.
4.20 P.M No surprise an up day again. Just tells you the amount of shorts that had been caught on the wrong/early side and how much the doomsday psyche got ingrained into the society. The volume is indicative a waning short squeeze. We think it would be good to keep adding short slivers in SPY or other such stable index (with minimal slippage) for the counter thrust down. My astro friend traders tell me May6-7th is an important pivot day. We don't give much too much weight to astro aspects etc, but undeniably the rally is getting long in the tooth. Lets do some projections on XLE, the triangle breakout did occur, as expected. The width of the triangle is about 5$. There is about 1-2$ left on the upside left as per the projections. So there is not much left in it for a gamble. Tack on another 5% to the SPX. We get atmost 940-950, we believe that will be the maximum for this rally leg.
The risk/reward is now shifting favorably to the short side. We'll keep an eye/ear out for the sentiment. We are definitely hearing green shoots repeated increasingly. While the bears are still in denial and cries of PPT manipulation are still around, it seems like the squeeze is beginning to running out of steam. Meanwhile asian indices which have well and truly been the leaders are also beginning to tire. We could see a nice downdraft over the next couple of weeks. We'll refine our cycle model for the turn low later on after we see sure sign of a top.
Friday, May 1, 2009
May 1
11.00 a.m. Covered some GILD from 47.5 @45. Will add some more higher. This bounce is working off the hourly oversold condition.
11:40 a.m. Add some short GILD at 45.35. Started a small position in UNG. We don't know if the bottom is here. We will bail if the LOD is broken. To us, it looks like accumulation is going on. For conservative traders (in natural gas it is wise to be conservative), wait for consecutive closes above 50d.
4:10 p.m We are now very overbought, so the market may have a pullback into the week of May 11th, our cycle turn (potential low). We are bullish into june. Technically, volume is waning, both on the upside and down. So the old norm of SPY 200M is a highly liquid day volume wise. It is very rough to play against the trend, the trend is up and we don't want to micromanage every turn. We find quite a few (including ourselves) traders expecting a pullback since the market is overbought and trying to time the pullback with a short position. It is much easier to buy the stock and forget until we see signs of exhaustion or excessively positive sentiment. On the commodity side, silver, gold are looking vulnerable. Natural gas had what we call a super double thrust. Two days back to back with increasing percent gains on increasing volume. It looks like accumulation is going on in natural gas. The area where this has occurred is 3.2 region. That should not be a surprise to us, given the 20 yr trendline. That being said, the test for natgas lies ahead at the 20d and more importantly the 50d.
Sentiment wise, (at the risk of being contrarian, which comes easily to one and all :-) ) we are beginning to hear analysts coming out of the closet and call for SPX 1000 or so. But there are still some doubts lingering in minds of newsletters like CNBC, WSJ and calling for the next shoe to fall etc. Stock message boards are still teeming with lots of people waiting for the big kahuna event. There are some who are caught with explosive short positions in FAZ, SKF, TZA who are brimming with cynicism. This what the rally needs to keep going. Before we reach a substantial top into which one should turn aggressively short, we will probably see the fabulous four of Summers, Geithner, Bernanke and Obama ordained for pulling us out of this recession. Think of it as follows, the more optimistic news we get, the closer this rally is to its end. As of now, people don't seem to have forgotten the crash in sept-oct 08 and are still ginger about it. Maybe it really takes a coppockian 11 months for another crash, a wave 3-of-3-of-C(3?). If and when that happens, that will be a bigger crash than the crash of sep 08.